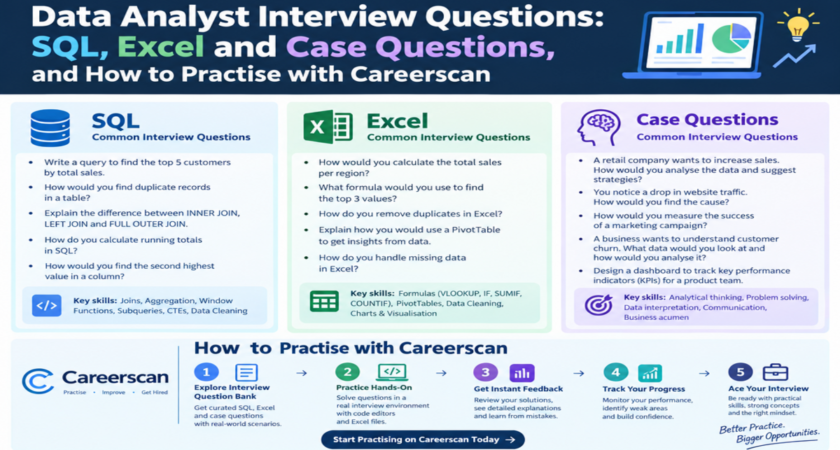
Data analyst interviews test whether you can turn messy data into a clear answer. Expect SQL questions, statistics basics, a spreadsheet or visualisation tool, and a case where you explain what the numbers mean for a business. Interviewers care less about memorised syntax and more about how you think.
Here are the core questions to prepare.
SQL, statistics and analysis questions
1. What is the difference between INNER JOIN, LEFT JOIN and FULL JOIN? Explain which rows each keeps, and give an example, such as customers with and without orders.
2. What is the difference between WHERE and HAVING? WHERE filters rows before grouping and HAVING filters groups after aggregation.
3. How would you find duplicate records in a table? Group by the identifying columns and filter for counts above one. Mention window functions such as ROW_NUMBER() for removing duplicates.
4. What is the difference between mean, median and mode, and when would you use each? Use the median when data has outliers, such as salaries or order values.
5. How do you handle missing or dirty data? Show a process: check how much is missing and why, then decide whether to drop, fill or flag it, and document the choice.
6. What is a p-value, in plain words? Explain it as how surprising your result would be if nothing was really going on. Avoid heavy jargon.
Practise explaining your analysis out loud
Writing a correct query is one skill. Explaining your thinking to an interviewer is another, and it is the one that needs practice. Careerscan helps you build it.
Careerscan reads your resume against the data role you want, then interviews you on it. A data and SQL specialist interviewer asks about the skills in the job and the projects on your resume, and follows up when an answer is thin.
- Questions come from your resume, the job’s skills and what the company is reported to ask
- Answer by voice or text, one question at a time
- Each answer is scored on 8 clear criteria, quoting your own words and showing what a stronger answer would include
- Every weak spot becomes a short lesson and practice round
Ready to see how you perform? Start free on Careerscan (15 free credits, no card needed)
Case and project questions
7. A key metric dropped 15% last week. How would you investigate? Structure your answer: confirm the data is correct, segment by time, region, product and channel, check for recent changes, then form and test hypotheses.
8. How would you measure the success of a new feature? Define the goal, choose a primary metric and guardrail metrics, and describe how you would compare users with and without the feature.
9. Which chart would you use to show a trend, a comparison and a share of a whole? Line for trends, bar for comparisons, and a stacked bar or pie only for a few parts. Explain why clarity matters more than decoration.
10. Tell me about an analysis you did and what happened because of it. This is where many candidates lose points. State the question, your method, your own contribution, and the business result.
How to answer well
- Clarify the question before touching the data.
- Think out loud so the interviewer can follow your reasoning.
- Tie every answer to a business decision.
- Say “I” for what you did, not only “we”.
- Add numbers such as time saved, revenue or accuracy improved.
The bottom line
Great analysts are clear thinkers who can explain what the data means. Learn the concepts, then practise saying your answers aloud on questions drawn from your own projects.
Find your gaps before the interview does. Start your free Careerscan interview and walk in already practised.